

The evolution of financial conditions in the euro area and the United States: a Macro-Finance FCI perspective
Prepared by Tilman Bletzinger, Giulia Martorana and Jakub Mistak
Published as part of the ECB Economic Bulletin, Issue 6/2026.
Shifts in market expectations for the stance of US monetary policy can influence global financial conditions, including through spillovers to the euro area. Market expectations for US policy interest rates were revised significantly in both directions over the summer, amid heightened geopolitical risks and an uncertain economic outlook. As risks and uncertainty persist, policy rate paths for both the United States and other advanced economies remain subject to further reassessments. For the United States, the impact of such monetary policy reassessments is unlikely to remain confined to the domestic economy: a large body of empirical literature finds that US monetary policy shocks are transmitted strongly to euro area financial conditions.[1]
To shed light on these spillovers, this box extends the Macro-Finance Financial Conditions Index (FCI), originally developed for the euro area, to the United States. The framework has several features which carry over to the US case.[2] The FCI is estimated through a vector autoregressive (VAR) model to summarise the information contained in a set of financial prices in a single index that is relevant for macroeconomic dynamics.[3] It incorporates financial variables with minimal transformation and is expressed in units and a scale comparable to those of a policy rate. The US specification combines the effective federal funds rate, the ten-year Treasury yield, the real two-year forward Treasury rate one year ahead and real five-year spot Treasury rate, the mortgage and corporate bond spreads over Treasuries, the cyclically adjusted equity price-to-earnings (CAPE) ratio and the nominal effective exchange rate of the US dollar.
The estimated coefficients point to a dominant role for interest rates, alongside smaller contributions from credit spreads and equity valuations (Chart A, panel a). The effective federal funds rate carries the highest coefficient (0.63), followed by the two real rates (around 0.45 each) and the ten-year Treasury yield (around 0.40). The mortgage and corporate bond spreads enter with smaller coefficients (of about 0.11 each), capturing risk premia and borrowing costs for households and firms. The CAPE ratio carries a negative coefficient, consistent with higher equity valuations implying looser financial conditions. The dollar exchange rate receives the smallest positive weight, reflecting the relatively low trade openness of the US economy and the role of the US dollar as a global currency.[4]
Chart A
The US Macro-Finance FCI
a) FCI coefficients
(coefficients)

b) The US Macro-Finance FCI and its decomposition
(index)

Sources: LSEG, Haver Analytics and ECB staff calculations.
Notes: In panel a), the blue bars show the estimated coefficients of the variables entering the US Macro-Finance FCI; the yellow markers show the same coefficients normalised to sum to 100. In panel b), the index is decomposed into “short-term rate” (effective federal funds rate), “long-term rate” (ten-year Treasury yield), “real rates” (real two-year forward Treasury rate one year ahead and real five-year spot Treasury rate), “mortgage spread” (30-year mortgage rate less the 30-year Treasury yield), “risk assets” (A-rated corporate bond spread over the ten-year Treasury yield and the CAPE ratio) and “exchange rate” (nominal effective exchange rate of the US dollar). The latest observations are for 28 August 2026.
The US Macro-Finance FCI tracks the key economic and financial episodes in the United States since 1999 (Chart A, panel b). The index tightened persistently during the Federal Reserve System’s 1999-2001 interest rate hiking cycle and reached its all-time high during the global financial crisis, with a tightening stemming from risk assets. It was stable over the period 2010-14, with the federal funds rate near the effective lower bound, and fell to its lowest level in August 2021 following the policy easing related to the COVID-19 pandemic. The most pronounced tightening in the sample was the 2022-24 hiking cycle. The financial conditions then loosened throughout 2025 as the Federal Reserve began cutting rates, before tightening following the outbreak of the war in the Middle East. The index broadly co-moves with established US benchmarks, particularly during episodes of financial market stress, although it diverges at times owing to the benchmarks’ heavier reliance on equity prices (Chart B).[5]
Chart B
The US Macro-Finance FCI and other US FCIs
(indices)

Sources: LSEG, Haver Analytics and ECB staff calculations.
Notes: “GS FCI” is the Goldman Sachs FCI, “WA FCI” the weighted-average FCI and “FCI-G” the Financial Conditions Impulse on Growth. All FCIs are z-scored. The latest observation for the FCI-G is for July 2026. For all others, the latest observation is for 28 August 2026.
The US and euro area Macro-Finance FCIs display broadly synchronised dynamics, with the correlation between US and euro area financial conditions primarily explained by risk assets. Chart C plots the two indices in terms of gaps versus their model-implied unconditional means, such that zero corresponds to financial conditions consistent with inflation at target and output at potential in the respective VAR models, making the indices broadly comparable.[6] Chart D captures this co-movement through the rolling correlation between the two indices, decomposed into the additive contributions of the main channels. The correlation remains positive throughout the sample and increases during episodes of global stress, such as the post-global financial crisis period and the pandemic. Risk assets are the dominant channel linking the two indices, while real and long-term rates make smaller but persistent positive contributions, particularly between 2022 and 2025, when the Federal Reserve and the ECB responded in broadly similar ways to a common inflation shock. By contrast, the foreign exchange channel reduces the correlation between the US and euro area FCIs during periods of monetary policy divergence between the ECB and the Federal Reserve.
Chart C
The Macro-Finance FCI gaps for the United States and the euro area
(indices)
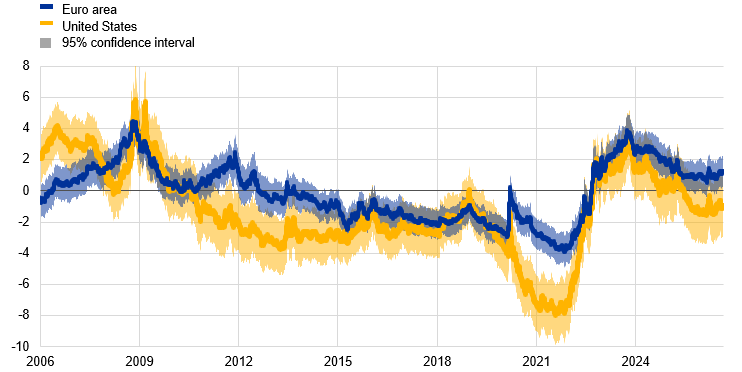
Sources: LSEG, Haver Analytics and ECB staff calculations.
Notes: Each Macro-Finance FCI is shown in terms of a gap versus its unconditional mean, which is the value consistent with inflation at target and a closed output gap. The shaded bands reflect parameter estimation uncertainty. The latest observations are for 28 August 2026.
Chart D
Time-varying correlation between US and euro area financial conditions, decomposed by channel
(correlation coefficients)

Sources: LSEG, Haver Analytics and ECB staff calculations.
Notes: The chart shows the rolling correlation between the five-trading-day changes in the US and euro area Macro-Finance FCIs, computed over a trailing window of 252 trading days and decomposed into contributions from the euro area channels, which are shown as coloured bands. The sample starts on 5 January 2006. The latest observations are for 28 August 2026.
Unexpected changes in US policy rates significantly affect euro area financial conditions, with the spillover transmitted mainly through risk assets. Chart E shows the estimated one-day responses of the US and euro area FCIs to an unexpected 25 basis point tightening shock in either jurisdiction.[7] A Federal Reserve tightening shock raises both the US FCI and, to a smaller extent, the euro area FCI, with the spillover driven primarily by risk-asset repricing and partly offset by the exchange rate channel.[8] An equally sized ECB tightening shock raises the euro area FCI across long-term rates, real rates and risk assets, while having little impact on the US FCI.
Chart E
Decomposition of the Macro-Finance FCI responses to US and euro area monetary policy shocks
(indices)

Sources: LSEG, Haver Analytics, Jarociński and Karadi (2020) and ECB staff calculations.
Notes: Responses of the US (left panel) and euro area (right panel) Macro-Finance FCIs to 25 basis point Federal Reserve and ECB monetary policy shocks, identified from high-frequency surprises around the respective policy announcements. The dark blue markers show the response of the headline index; the coloured bars show the additive contributions of the individual channels.
Looking ahead, changes in the expected US policy rate path could affect euro area financial conditions, with risk assets likely to remain a key propagation channel. The estimates presented in this box suggest that risk assets account for most of the response of euro area financial conditions to US monetary policy shocks, by far the largest and statistically most robust of the channels considered. This reflects the high degree of integration of global equity and corporate bond markets and means that changes in the compensation required for holding US risk assets tend to spill over to euro area risk assets, transmitting US monetary policy to euro area financial conditions. Any reassessment of market expectations regarding the US policy rate path could therefore be followed by a broad-based repricing of risk assets and a spillover to euro area financial conditions irrespective of the ECB’s policy stance.
References
Ajello, A., Cavallo, M., Favara, G., Peterman, W.B., Schindler, J. and Sinha, N.R. (2023), “A New Index to Measure U.S. Financial Conditions”, FEDS Notes, Board of Governors of the Federal Reserve System, 30 June.
Arrigoni, S., Bobasu, A. and Venditti, F. (2022), “Measuring Financial Conditions using Equal Weights Combination”, IMF Economic Review, Vol. 70, pp. 668-697.
Bernanke, B.S. and Kuttner, K.N. (2005), “What Explains the Stock Market's Reaction to Federal Reserve Policy?”, The Journal of Finance, Vol. 60, No 3, pp. 1221-1257.
Bletzinger, T., Martorana, G. and Mistak, J. (2026), “Looser, tighter, clearer: a new Financial Conditions Index for the euro area”, Working Paper Series, No 3193, ECB, February.
Caballero, R.J., Caravello, T.E. and Simsek, A. (2026), “FCI-star”, NBER Working Papers, No 33952, National Bureau of Economic Research, revised.
Ca' Zorzi, M., Dedola, L., Georgiadis, G., Jarociński, M., Stracca, L. and Strasser, G. (2023), “Making Waves: Monetary Policy and Its Asymmetric Transmission in a Globalized World”, International Journal of Central Banking, Vol. 19, Issue 2, June, pp. 95-144.
Grothe, M., Helmersson, T., Quint, D. and Vassallo, D. (2021), “Risk of spillovers from US equity market corrections to euro area markets and financial conditions”, Financial Stability Review, ECB, May.
Hatzius, J., Stehn, S.J., Fawcett, N., Fishman, K.R. (2017), “Our New G10 Financial Conditions Indices”, Global Economics Analyst, Goldman Sachs, 20 April.
Jarociński, M. and Karadi, P. (2020), “Deconstructing Monetary Policy Surprises – The Role of Information Shocks”, American Economic Journal: Macroeconomics, Vol. 12, No 2, April, pp. 1-43.
Legal Disclaimer:
EIN Presswire provides this news content "as is" without warranty of any kind. We do not accept any responsibility or liability for the accuracy, content, images, videos, licenses, completeness, legality, or reliability of the information contained in this article. If you have any complaints or copyright issues related to this article, kindly contact the author above.
